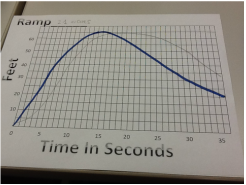
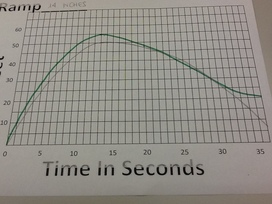
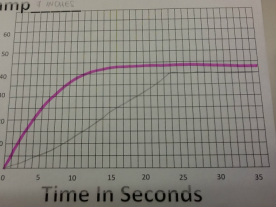
A. My first and third prediction weren't very close, but the second one is pretty similar to the actual graph.
The first and third one are different from their actual graph because those increase and in the fist example also decrease more quickly. Initially I thought the skateboard was going fast, but less than in the reality.
B. The zeros of my graph represent the instant in which Mr. Kelly release the skateboard.
C. The three graphs have the same zeros because they start from the same point in different heights, the maximums decrease from the first graph to the third one because the height at the beginning decrease and the minimums increase from the fist graph to the third one because the height at the beginnig decrease reducing the rate.
D.The graph is rising the fastest at the beginnig when the skateboard has more acceleration. It is falling the fastest after the maximum because the skateboard has more speed than at the end.
 |  |
 RSS Feed